Home
Excel Pivot Tables & Introduction To Dashboards The Step-By-Step Guide
Barnes and Noble
Loading Inventory...

Excel Pivot Tables & Introduction To Dashboards The Step-By-Step Guide in Franklin, TN
Current price: $12.99
Barnes and Noble
Excel Pivot Tables & Introduction To Dashboards The Step-By-Step Guide in Franklin, TN
Current price: $12.99
Loading Inventory...
Size: OS
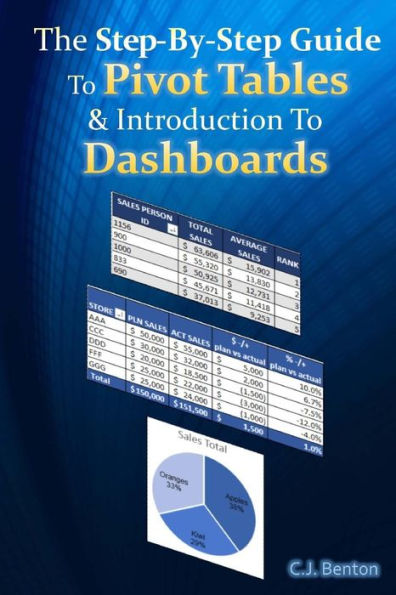
Learn how to create Pivot Tables quickly and easily with this step-by-step guide!
Updated for Microsoft(R) Excel(R) 2016! This book provides easy to follow
step-by-step examples
with
screenshots
demonstrating how to create Pivot Tables and basic Dashboards.
**Version 2019 is now available**
Organize and summarize data
Format & filter Pivot Table results
Create Pivot Charts
Display averages & percentages
Group data into predefined ranges
Use Slicers
Rank results
Apply calculated fields
Create Pivot Table reports from imported files
And more!
In addition to the above, you will also learn how to create, format, and update a basic Dashboard using Pivot Table data. Including how to incorporate charts and performance symbols into your reporting.
A great resource for:
Business Analysts
Data Analysts
Financial Analysts
Administrative and Support staff
Imagine the time you'll save by not having to search the internet or help files to learn the most practical ways of using one of Microsoft(R) Excel's(R) best features!